Rising Inventory Is Not a Crash: What Boston Condo Sellers Should Actually Do About It
There are 1,257 condos for sale in Boston right now. A year ago there were 1,092. That is 15% more competition, and it is the number every headline is built around.
Here is the number nobody is writing about: the average Boston condo that sold this year closed at $1,161,196, up 4.9% from last year. Sellers are still getting 97.4% of their original asking price.
Both things are true at the same time. More inventory, higher sale prices. If that sounds contradictory, it isn't. It just means the market is doing something more specific than "going up" or "going down," and the sellers who understand the difference are the ones who are still getting paid.
What the data actually says
These are the year to date figures for Boston condos through August 26, 2026, compared to the same point in 2025:
- Active inventory: 1,257 units, up 15.1% from 1,092
- Months supply of inventory: 4.40 months, up from 3.63
- Absorption rate: 22.74%, down from 27.55%
- Units sold year to date: 2,355, down 3.8% from 2,447
- Average sale price: $1,161,196, up 4.9% from $1,106,755
- Average sale price per square foot: $923.97, up 2.5% from $901.08
- Average days on market for sold units: 55, up from 52
- Sale price as a percentage of original list price: 97.44%, down from 97.76%
Read that list again slowly. Supply is up meaningfully. Demand is down slightly. And prices went up anyway.
The stat that matters most, and it barely moved
If Boston condos were actually falling apart, the first place it would show is the ratio of sale price to original list price. That number tells you what sellers are actually collecting versus what they asked for on day one.
Last year that number was 97.76%. This year it is 97.44%.
That is a difference of about one third of one percent. On a $1.2 million condo, it is roughly $3,800. Measured against the most recent asking price rather than the original, sellers are collecting 98.81%, down from 99.04%. It is not a crash. It is not even a correction. It is noise.
The same is true of speed. Condos that sold this year took an average of 55 days on market, versus 52 last year. Three days. Average days to a signed offer went from 38 to 40. Two days.
Boston condos are still selling, still selling near ask, and still selling in under two months. That is the actual state of the market, and it is very different from the one described by the phrase "inventory is surging."
Where the inventory is actually piling up
This is the part that matters if you are the one holding the keys.
The average active listing in Boston is asking $1,574,628. The average condo that actually sold this year went for $1,161,196.
That is a gap of more than $413,000. Put another way, the inventory sitting on the market is priced about 36% above what the market is proving it will pay.
The days on market numbers tell the same story from the other direction. The condos currently sitting on the market have been listed an average of 94 days. The ones that sold closed in 55. What sells, sells reasonably fast. What doesn't, accumulates.
Worth noting: that 94 day figure is actually down from 98 a year ago. The inventory that is sitting is not sitting longer than it used to. There is simply more of it, and it is clustered at the top. The average asking price on active inventory dropped 6.5% year over year even as sale prices rose, which tells you the composition of what is available has shifted, not that values fell.
If you own a well priced condo in a desirable building, you are not competing with 1,257 units. You are competing with the handful that are priced where buyers are actually transacting.
About one in three listings is cutting its price
Here is the strongest evidence that this is a pricing problem and not a demand problem.
So far this year, 1,544 Boston condo listings have taken a price change. That is up 9.6% from 1,409 last year. Against the 4,878 listings that came to market this year, it works out to roughly one in three.
And look at what is getting cut. The listings that changed price started at an average original ask of $1,085,929, down 11.5% from last year, but at $1,357 per square foot, up more than 40%. Translation: the listings taking cuts are smaller units carrying premium per foot pricing. That is a very specific kind of mistake, and it is one a seller makes at the listing appointment, not one the market does to them in month three.
Meanwhile the condos that sold closed at $923.97 per square foot. The gap between what the price cutters asked and what the market pays is not subtle.
What this means if you are selling this fall
Price it to the last 90 days, not to last spring. The comps that matter are the ones that actually closed, not the ones sitting unsold at aspirational numbers. When active inventory is asking 36% more than closed sales are delivering, half the "comparable listings" your neighbor points to are not comparable to anything. They are just expensive.
Your first two weeks are the whole ballgame. Sold condos averaged 40 days to a signed offer. Listings that are still active have been out there 94 days. Nothing about a listing improves with age. Price it right on day one and you get the buyer pool that has been waiting; price it 10% high and you get to be the comp that makes someone else's condo look like a deal.
A price cut costs more than pricing correctly the first time. Roughly one in three listings is finding this out. By the time you reduce, you have already lost the attention of the buyers who were watching when you launched, and buyers who show up later read time on market as a negotiating lever.
Do not panic about 4.4 months of supply. A balanced market is generally considered to be around six months. At 4.40 months, Boston condos are still tilted toward sellers. This is the most breathing room buyers have had in a while, and it is still not a buyer's market.
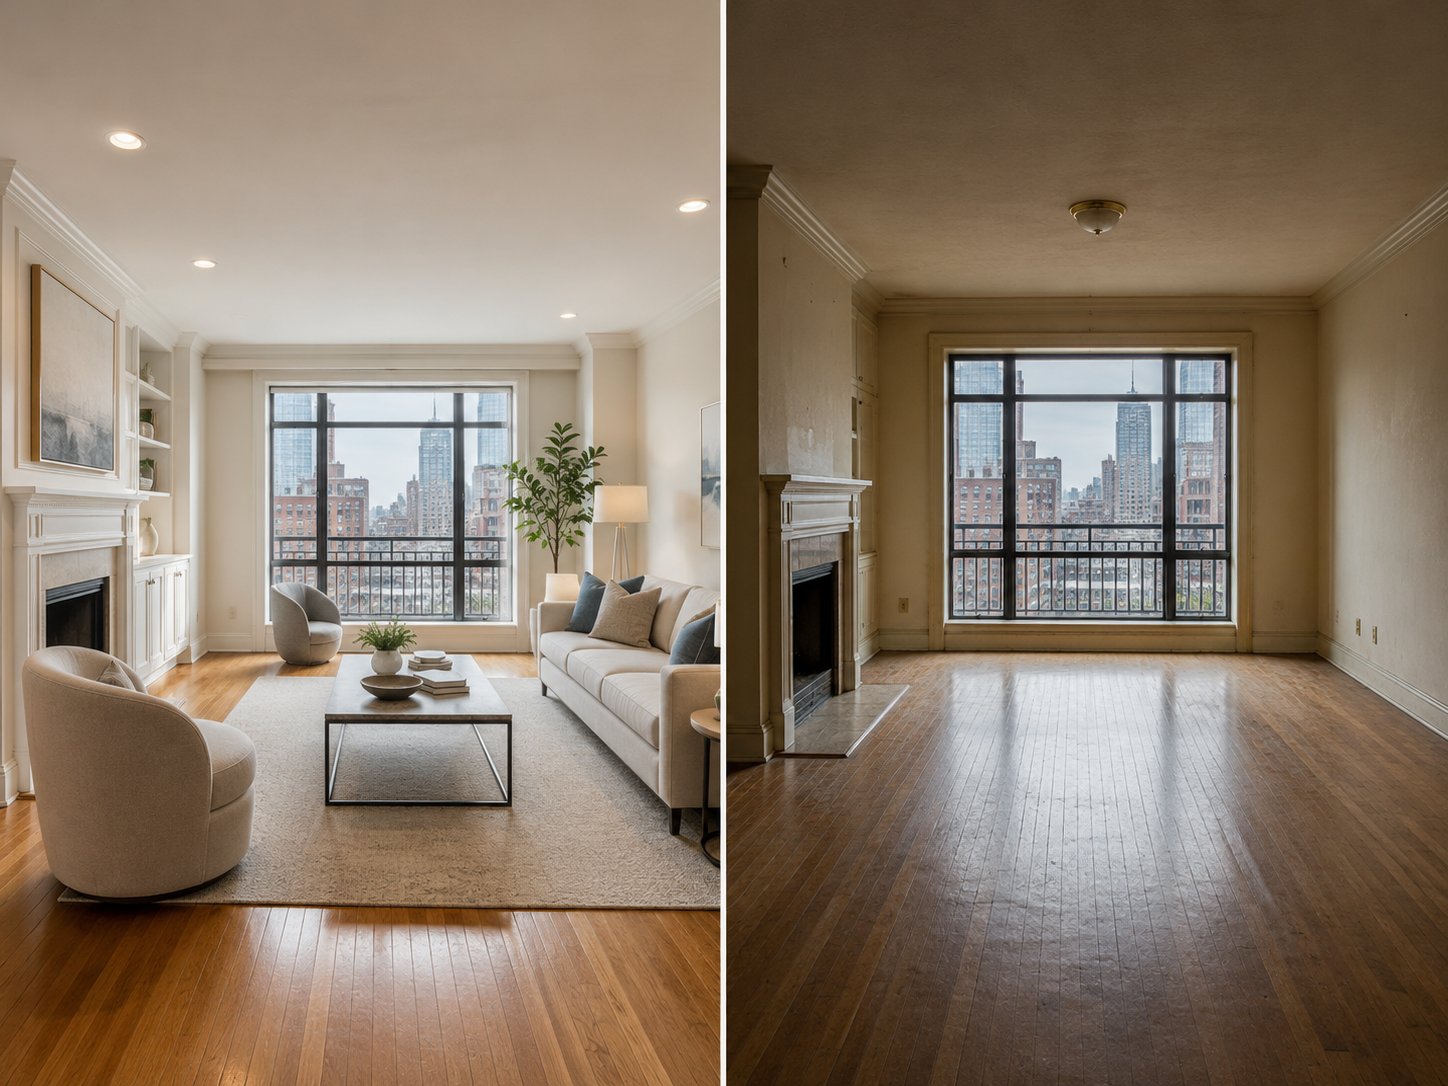
Presentation is doing more work than it was a year ago. When there were 1,092 units competing, buyers forgave a lot. With 165 more to choose from, they compare. Staging, photography, and a genuinely clean unit are now worth real dollars rather than just a faster close.
The bottom line
The Boston condo market in 2026 is not falling. It is getting pickier.
Buyers have more to choose from, so they are choosing more carefully and rewarding sellers who priced honestly. Sale prices are up almost 5%. Sellers are still collecting more than 97 cents on the original asking dollar. Well priced condos are still going under agreement in about 40 days.
The sellers who will struggle this fall are the ones who price to a market that ended in 2022 and then spend three months discovering it. The sellers who do well are the ones who look at what actually closed, price to that, and let the inventory number be somebody else's problem.
If you are thinking about selling this fall and you want to know where your specific condo sits against what is really closing in your neighborhood, that is a conversation worth having before you pick a number, not after.
Data source: MLS Property Information Network, Inc., Boston, MA Area Market Review, 2026 vs. 2025 as of August 26, 2026. Information gathered from third parties, including seller and public records. MLS PIN and subscribers disclaim all representations and warranties as to its accuracy. All figures are averages.